

Cross-Study Analytics & Metrics
Why analyze validation metrics?
In standardizing and submitting clinical trial data, one can assess resource investment, productivity, and success via milestone monitoring or labor time tracking, without necessarily relying on byproducts of data conformance and quality validation. However, such byproducts can inform and color the overall assessments, leading to multi-departmental process improvements that improve quality and timeliness of submission data while reducing overall costs and risks.
Using Cross-Study Analytics and Metrics: Cases from the Field
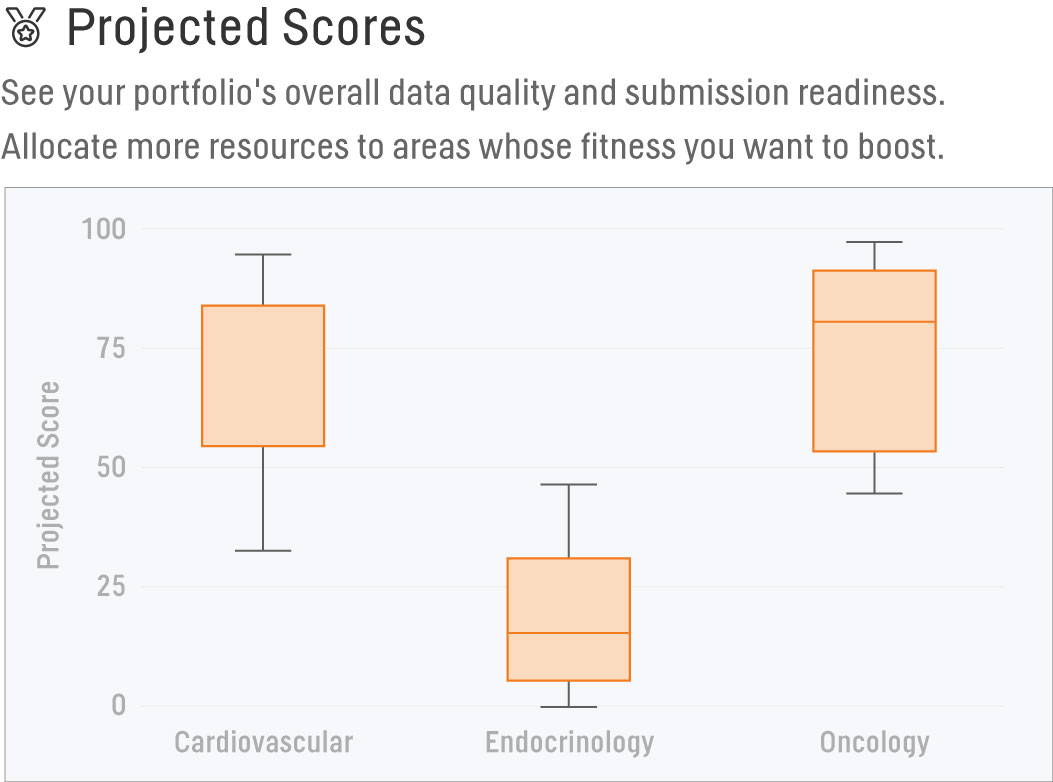
Projected Scores
We have different standards teams based on Therapeutic Area, and we'd like to allocate more resources to help boost our Scores. The Projected Scores report allows us to filter by TA across data packages validated within the past year to see which TA’s Projected Scores fall below the median baseline. With this information, we’re able to determine where to concentrate our efforts and create more robust standards or provide further TA-specific training. Our effectiveness will be verified through the same report during the following year, where the updated analysis should show increased baseline Projected Scores across those chosen TA’s.
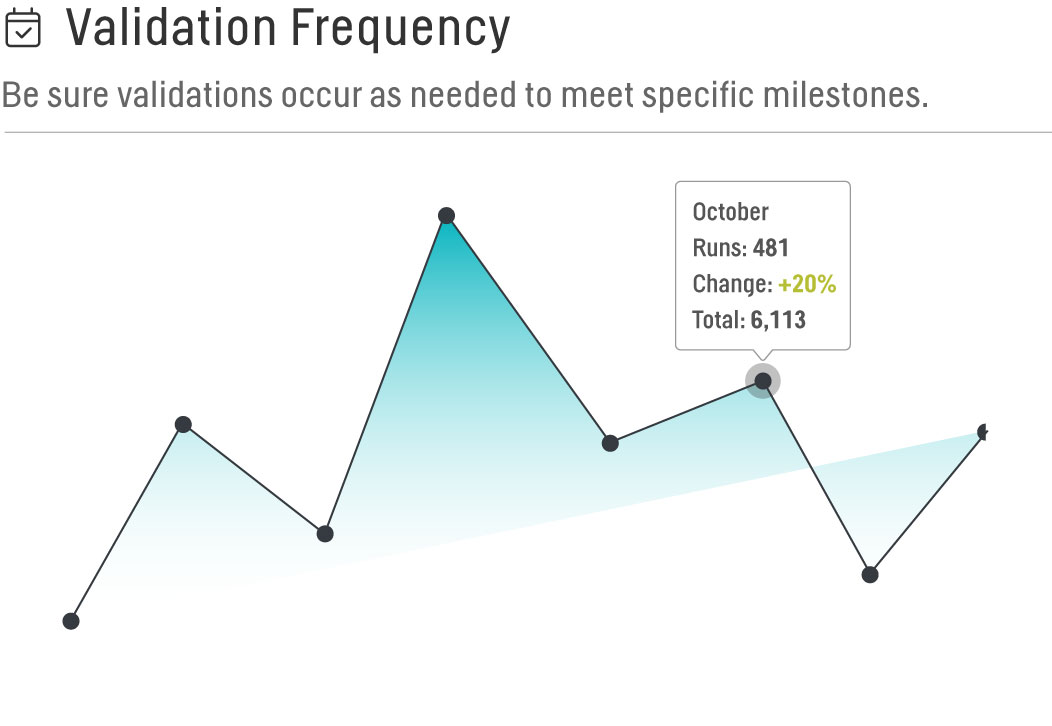
Validation Frequency
We oversee several different studies, each with its own unique timelines for submission and want to be sure validations are occurring as needed to meet specific milestones. By comparing our Master Study List to the Validation Frequency report, we’re able to ensure that as critical time points in each study approach, the number of validations increases. The ability to quantify this in real-time also gives us the power to recognize when validations are not occurring as expected and proactively work to resolve any discrepancies.
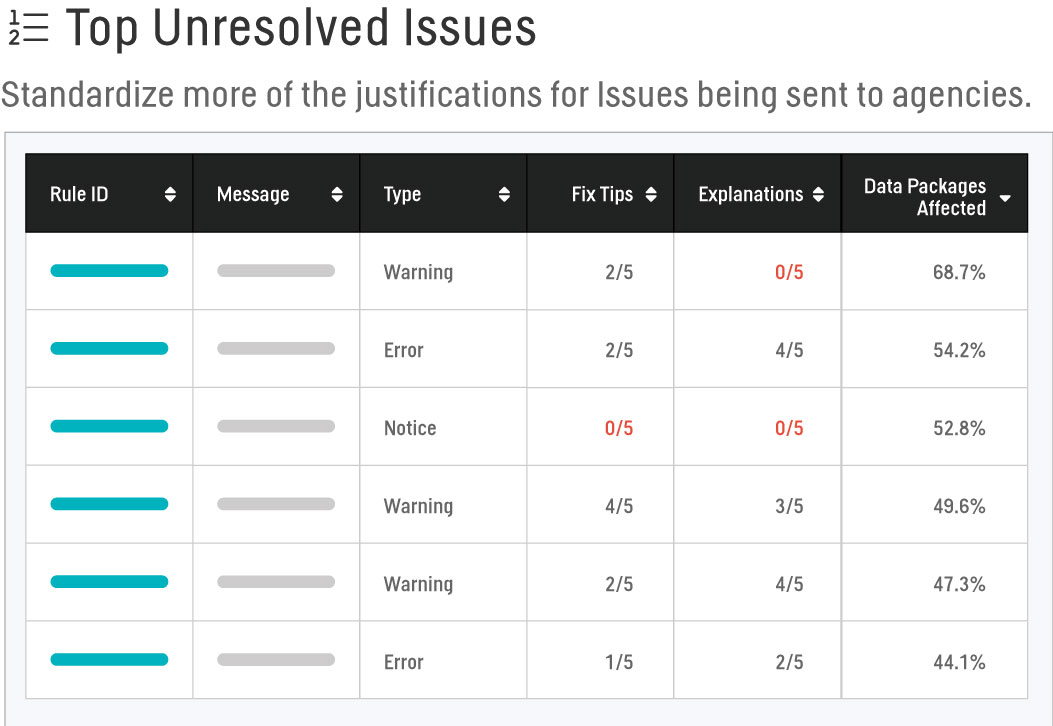
Top Unresolved Issues
We would like to develop our own Fix Tips and Explanations to guide our users and standardize more of the justifications for issues being sent to the agencies via the Data Reviewer’s Guides. However, it is too cumbersome to go through every single Rule ID or combine reports to find our portfolio’s most prevalent issues. Using the Top Unresolved Issues report, we’re able to view the top 50 issues by standard, date last validated, and data package status that are most frequently occurring across all studies. Sorting by Type further provides a starting point at which we can perform any root cause analyses to aid in the adjustment of our standards, forging of Fix Tips, or establishment of our Explanations.
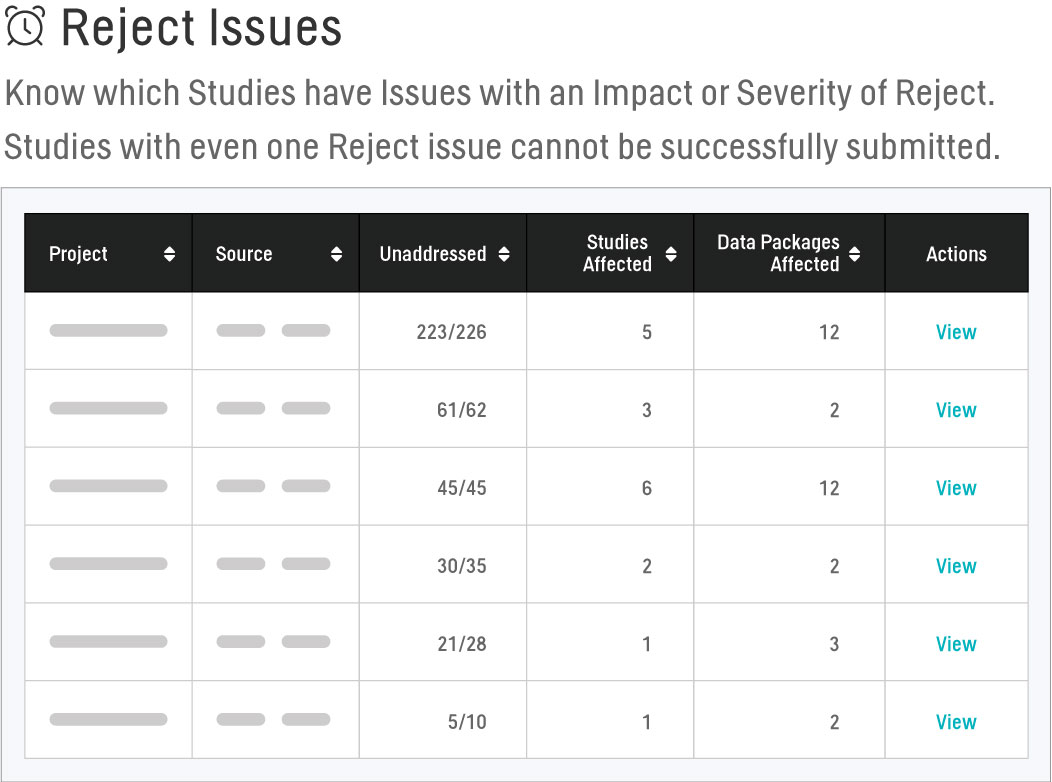
Reject Issues
Studies cannot be successfully submitted with any issues that have an Impact or Severity of Reject; therefore, it is essential to monitor these types of issues across all trials to ensure they are being resolved as early in the validation life cycle as possible. Using the Reject Issues report, we’re able to easily view the quantity of Reject issues present within a Project, the breakdown of this total by study and data package, and the sum of Reject issues that are Unaddressed (present with a Status of Open, To Close, or Closed). We can delve deeper and view a table containing each Reject issue found in the Project and use this to quickly triage these issues so that they’re routed to the appropriate team member for resolution.
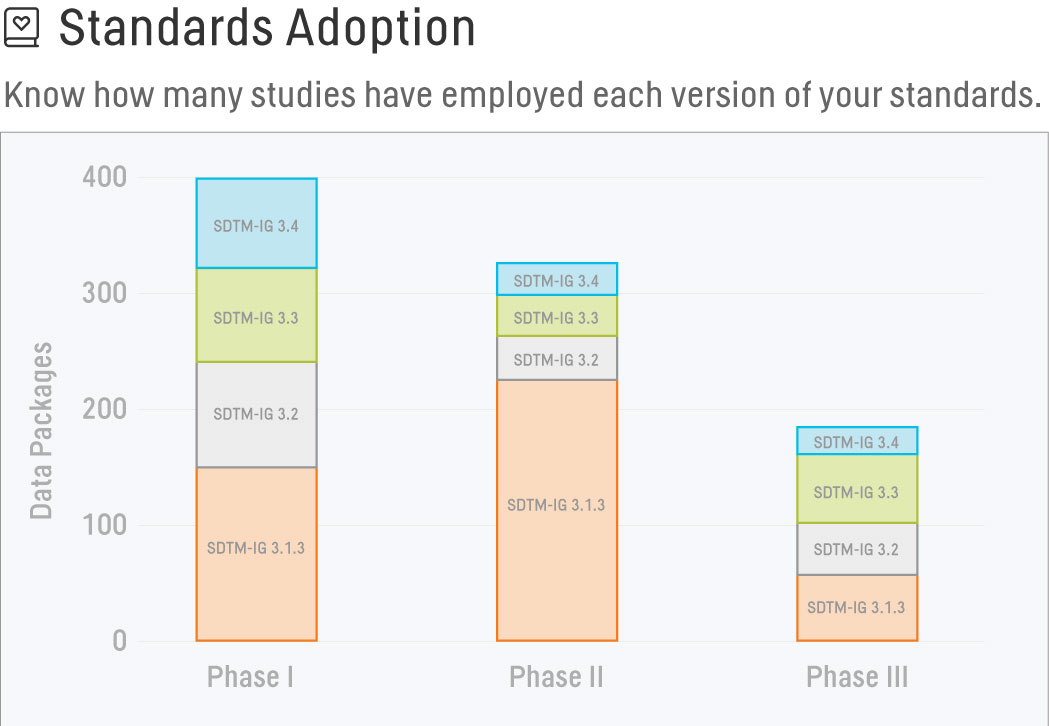
Standards Adoption
Our standards team has spent countless hours developing and maintaining standards for our organization, and we would like to know how many studies have employed each version of our standards. On the Standards Adoption report, we’re able to see the number of data packages configured with each version of the selected standard across Projects and Studies. Comparing this report against a Master Study list, we can also easily determine if any data packages have been configured with an incongruent version of a standard and request a team member take corrective action.
Leaderboards
We’ve been asked to provide a list of names of internal employees, as well as those within our FSP CRO’s, who should be presented with the opportunity to bear the special title of Pinnacle 21 Enterprise Guru and provide input on training materials, mentoring, and user feedback for our organization. By examining the Leaderboards report, it’s easy to see who the most active users in our environment are based on the number of validations run, issues managed, and define/spec changes made. These categories will also allow us to indicate the specialty of each Guru and the visibility of each user’s email address allows us to determine each leader’s affiliation.
Pinnacle 21 Enterprise Analytics of the Future
As P21 Enterprise evolves, we plan to incorporate our industry’s needs and technology in the expansion of our Analytics offerings. Imagine the ability to automatically plug CTMS data directly into P21E to view study-specific milestones within relevant reports. Or how rewarding and reassuring it would feel to see your data package’s Data Fitness Score compared with other, similar de-identified Data Fitness Scores from across the industry, matched at similar study milestones, including at the time of submission to different regulatory agencies. This is all within our reach, as the data exist, they simply need to be transformed into metrics and harnessed through the power of analytics, ingenuity, and a little imagination.

